All published articles of this journal are available on ScienceDirect.

Spatial-temporal Patterns and Determinants of Accident Severity on the Malaysian Inter-urban Expressway: An Ordinal Logistic Regression Approach
Authors Info & Affiliations
Abstract
Introduction/Objectives
Road accidents on inter-urban expressways in Malaysia exhibit spatial concentration and varying severity levels, requiring empirical analysis to support targeted safety interventions. This study examines spatial–temporal accident patterns and identifies key determinants of accident severity on the Shah Alam Expressway.
Methods
A dataset of 2,823 accidents (2013–2017) was analysed using descriptive statistics and 400 m spatial segmentation. Clustering was assessed using scatter plot outlier analysis and Global Moran’s I. An ordinal logistic regression model was applied to examine factors influencing accident severity.
Results
Accident frequency peaked at 728 cases in 2013, declined by about 30% in 2014–2015, then increased in later years. Persistent hotspots were identified at KM40.5–40.9 (both directions), with additional high-risk segments at KM27.0–27.4 and KM47.5–47.9 (eastbound) and KM49.0–49.4 (westbound). Global Moran’s I confirmed significant clustering at smaller scales (z = 3.086, p = 0.002). Most accidents involved property damage (61.9%), while 9.2% were serious or fatal. The regression model was significant (p < 0.001), with vehicle type as the strongest predictor.
Discussion
Accident reductions were not sustained, while persistent hotspots indicate location-specific risks requiring targeted interventions. Significant clustering supports localized measures. Although most cases were minor, severe accidents remain concerning. Vehicle type strongly influences severity, suggesting the need for differentiated safety strategies.
Conclusion
Accidents are spatially concentrated, and severity is strongly linked to vehicle characteristics. Site-specific and vehicle-focused interventions are essential to reduce accident severity effectively.
1. INTRODUCTION
Road transportation plays a vital role in Malaysia’s socio-economic development, facilitating the movement of people and goods across regions. Inter-urban expressways, in particular, form the backbone of the national highway network due to their high design standards, capacity, and accessibility. However, despite these advantages, recent statistics have shown an increasing number of road accidents occurring on Malaysian inter-urban expressways. This trend raises serious concerns regarding road user safety and the effectiveness of existing safety measures. An expressway is meant to avoid traffic and accidents. The increasing number of accidents on Malaysian expressways indicates that the road transport system in Malaysia still needs improvement. As a major transportation mode for most Malaysians, ensuring road safety on inter-urban expressways has always been a great concern to the local authorities.
The widespread connectivity of inter-urban expressways allows vehicles to travel at higher speeds over long distances, which can increase the likelihood of severe accidents when crashes occur. Accidents on expressways often result in significant economic losses, injuries, and fatalities, making road safety a critical issue for policymakers, highway authorities, and researchers. Therefore, there is a pressing need to systematically analyse accident characteristics and identify effective strategies to reduce both the frequency and severity of accidents.
Statistics have shown an increasing number of road accidents on Malaysian inter-urban expressways recently. In Malaysia, road accidents can occur everywhere on the inter-urban expressway due to its high accessibility to a wide range of highway networks. The primary objective of highway safety engineering revolves around the reduction of both the frequency and severity of traffic accidents. This is achieved through the identification, implementation, and assessment of various measures aimed at enhancing highway safety. By analysing data on the location, frequency, and severity of accidents, the government and other organizations can target their efforts to reduce accidents in the areas where they are most needed.
2. LITERATURE REVIEW
Many studies on road accident patterns have used spatial analysis techniques. A study by Halim et al. [1] focused on the E1 of the North-South expressway in Malaysia using spatial techniques, namely Nearest Neighborhood Hierarchical (NNH) Clustering and Spatial Temporal Clustering (STAC). The study found that the pattern of road accidents on the E1 resulted in a clustering pattern in which the accidents were grouped at a specific location. Another study was done for Malaysia on E1 and E2 of the North-South Expressway [2], which focused on determining the spatial pattern of road accidents using Moran’s I and accident hotspots using Getis-Ord Gi*. They also found that accidents occurred in clustering patterns where 64% of the accident hotspots occurred at interchange, ramp, lay by, slip road, or rest area.
Highway safety studies have consistently emphasized that rigorous analysis of accident data is essential for understanding contributing factors and designing targeted interventions. Recent reviews have highlighted the integration of statistical and machine-learning methodologies to reveal complex relationships between crash outcomes and risk factors such as road design, traffic flow, environmental conditions, and human behaviour. For example, systematic synthesis of crash data analysis methodologies underscores the evolution of traditional statistical models to advanced machine learning and real-time predictive systems, reflecting the diversity of modern approaches to crash risk evaluation and mitigation strategies in various global contexts [3]. Contributing factors are often categorized into key domains: roadway (geometry, lane configuration), traffic (volume, speed), vehicle (characteristics, condition), personal (driver behaviour), and environment (weather, visibility). Categorizing and prioritizing these factors enables landscape-level insights for policymakers and road authorities [4].
Road geometry and infrastructure form foundational elements in accident causation analysis. Geometric factors such as lane width, alignment, and the presence of complex intersections have been repeatedly linked with crash frequency and severity. In developing contexts, factors such as inadequate signage, poor road surface conditions, and non-standardized geometric features increase the likelihood of collisions. Studies utilizing exploratory factor analysis (EFA) and Fuzzy AHP have identified roadway geometry and surface conditions as key crash-related contributors, prompting recommendations for enhanced design standards and maintenance practices to mitigate risk [5]. The synthesis of recent literature also reveals a strategic tension between high-performance Machine Learning (ML) and robust Statistical Modeling in highway safety. Advanced ensemble techniques, such as Random Forest, XGBoost, and Gradient Boosting, consistently achieve superior classification accuracy (up to 94%) in large-scale datasets, as evidenced in studies from Saudi Arabia, New Zealand, and Brazil [6-9]. These models excel at identifying complex, non-linear patterns in traffic flow and infrastructure decay. However, a critical challenge was identified by [10, 11], which is the “rare event” problem; ML models often suffer from low recall for fatal injuries due to extreme data imbalance. In scenarios characterized by limited data or a clear hierarchical structure (e.g., Slight < Serious < Fatal), researchers frequently opt for Ordinal Logistic Regression (OLR) or Multinomial Logit models. Unlike “black-box” ML, OLR acknowledges the natural ranking of injury severity, requiring less data to produce statistically stable Odds Ratios. This transition ensures that even with small sample sizes, the model provides interpretable, causal evidence, such as the 10-fold increase in fatality risk for unbelted drivers, which is vital for evidence-based policy and emergency management.
In Malaysia, specific studies on expressways and high-risk inter-urban corridors have shown that expressway accidents tend to cluster around locations with high traffic volumes and complex geometric features, underscoring the need for systematic engineering reviews of these segments [12]. Traffic volume and speeding are among the most consistently identified factors in highway crash research across the globe. Higher traffic volumes correlate with greater conflict opportunities, while speeding amplifies crash severity, particularly on expressways and high-speed corridors. Malaysian research on the North-South Expressway has directly examined expressway crash severity using binomial logistic regression, finding significant relationships between pavement conditions, vehicle flow characteristics, and severity outcomes. These findings align with international evidence that speed and surface conditions interact to shape crash risk profiles on controlled-access highways [4, 13]. Broadly, machine-learning augmented approaches provide improved prediction of severe outcomes, with models identifying speed limits and collision types as dominant predictors of fatality [10, 14], highlighting the critical impact of traffic dynamics on safety in developing nations.
2.1. Factors Affecting the Level of Severity
Environmental conditions such as weather, lighting, and visibility are integral to understanding crash dynamics. Research demonstrates that adverse weather and low-visibility conditions substantially raise severity risk, particularly when interacting with high speeds and complex roadway segments.
In studies combining logistic regression and explainable machine learning, variables such as road surface condition, weather, and lighting emerged as significant determinants of severe expressway crashes, emphasizing the need for environment-specific safety design and mitigation strategies [15]. Human and behavioural factors remain central in highway safety analyses. Speeding, driver fatigue, distraction, and non-compliance with traffic laws consistently appear as major contributors to accident causation. Across developing countries, rapid motorisation has escalated these behavioural risks, exacerbating highway safety challenges by increasing the incidence and severity of crashes.
Recent Malaysian studies among young drivers found that driver distraction, limited visibility, and fatigue significantly affect road safety compliance, highlighting the need for targeted educational and enforcement interventions [16, 17]. Internationally, news from expressway contexts reinforces that fatigue and speeding are among the top factors in high-volume corridors, e.g., on India’s Agra–Lucknow Expressway, where driver fatigue accounted for a large share of accidents as traffic volumes grew [18]. Malaysia’s road safety landscape reflects both global trends and unique local challenges. Recent daily national accident statistics from enforcement agencies indicate continual high crash counts across the country, underscoring ongoing safety concerns [19]. Specific Malaysian expressway investigations have started to model severity outcomes and identify risk patterns. For example, logistic regression analyses of expressway data reveal that pavement and traffic characteristics are pivotal in influencing severity levels, signaling the importance of both infrastructure and flow management.
Moreover, high-profile crashes such as the 2025 Gerik bus collision on the East–West Highway in Perak [20] illustrate how human error and possible road condition factors can escalate into major highway disasters, prompting renewed public and scholarly attention toward systemic safety improvements. In the Malaysian context, several studies have examined accident trends on federal roads and urban highways. However, limited attention has been given specifically to inter-urban expressways, despite their strategic importance and relatively high accident severity rates. Hence, this study examines the spatial–temporal patterns of road accidents and identifies the key determinants of accident severity on the Shah Alam Expressway.
3. METHODOLOGY
This study involved three steps, which include data description, data segmentation and accident pattern identification.
3.1. Data Description
This study used secondary data acquired from the highway concession, KESAS Sdn. Bhd. It involved data on road accidents on the Shah Alam Expressway from 2013 to 2017. The Shah Alam Expressway serves as a critical longitudinal laboratory for traffic safety research, where its dynamic environment can be used for long-term observation. Due to its status as one of the region’s primary arterial routes, the high density and heterogeneity of its traffic flow provide a robust dataset for road safety research. For this study, the daily accident data of five consecutive years were investigated. The dataset encompassed information such as the accident location, date, and time of accident occurrence, type of vehicles involved, collision type, severity type, causal factors, weather conditions, and the property damage resulting from the accident. The data were then organized into a Microsoft Excel spreadsheet, and any missing data were discarded. Descriptive statistics were done in order to investigate the pattern of road accidents along the expressway.
3.2. Data Segmentation
The accident dataset consisted of accident locations in the form of kilometer markers. This study considered accidents at both routes of Shah Alam Expressway, which are the east-bound and west-bound, as well as at all intersections across the expressway. The locations are divided into segments, with a 400-metre segmentation used in this study, following the Interim Guide of the Public Works Department, which allows for road treatment of 300-500 metres around the accident location. The 34.5-kilometre expressway is divided into 70 segments from KM18 at Pandamaran to KM52.5 at Sri Petaling. Then, the number of accidents is mapped according to their segment and route using a check sheet. Table 1 represents the segmentation of the location, providing the organizational structure required to allocate accident frequencies of the locations (in kilometer markers).
| Segment | Location (KM) |
|---|---|
| 1 | 18.0 – 18.4 |
| 2 | 18.5 – 18.9 |
| 3 | 19.0 – 19.4 |
 |
|
| 69 | 52.0 – 52.4 |
| 70 | 52.5 – 52.9 |
3.3. Accident Pattern Identification
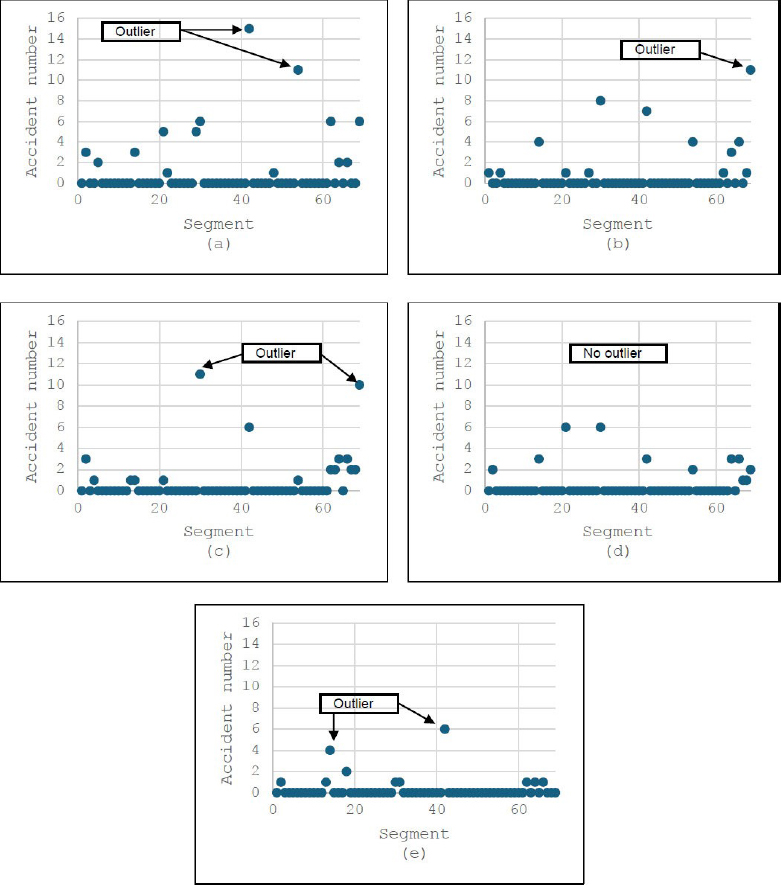
In order to identify the pattern of accident distribution at the expressway, a scatter plot was used based on data segmentation prepared in the previous step. A scatter plot is useful for identifying patterns in data distribution. For this study, it is used to determine whether the accident occurred at random places or clustered at certain places. The data points are grouped and observed on how closely sets of points are clustered together. Scatter plots can also show if there are any unexpected gaps in the data or any outlier points. The outlier is obtained by calculating the upper and lower limits, as in Eqs. (1 and 2).
 .......(1)
 .....(2)
Q1 and Q3 represent the first and third quartiles, respectively, while IQR is the interquartile range of the data. These values can be obtained from data analysis tools in Microsoft Excel. The calculated upper and lower limits serve as statistical thresholds that define the boundaries of expected data variance. Any data point falling within these two limits is considered part of the normal distribution of accident frequencies for the expressway. Conversely, an outlier is identified when a specific location's data point falls outside this calculated range. In the context of this study, a data point exceeding the upper limit is classified as an outlier. This indicates that the frequency of accidents at that specific segment is significantly higher than the rest of the dataset, marking it as a critical area of interest for safety analysis. While a point below the lower limit would also technically be an outlier, it represents an exceptionally low accident rate and is therefore excluded from the primary focus of the risk-based investigation.
Accident severity is categorized into fatal, serious injury, minor injury, and property damage only. The analysis aims to determine patterns that may indicate underlying safety issues, such as recurring accidents at specific locations or disproportionately high severity levels. The results of the analysis serve as a basis for proposing targeted safety interventions.
3.4. Modeling the Level of Severity: A Case Study
Analysing traffic accident data within the context of a heavily trafficked expressway, such as the Shah Alam Expressway, plays an important role in improving road safety on Malaysian expressways. As accident severity is an ordered categorical (ordinal) outcome, this study adopted an ordinal logistic regression modelling approach. The ordinal logistic regression model is designed to predict an ordinal dependent variable based on a set of independent variables. This method is appropriate when the response categories follow a natural order, but the distances between categories are not assumed to be equal.
Ordinal logistic regression assumes the existence of an underlying, unobserved continuous latent variable that gives rise to the observed ordinal categories. In the context of accident severity, this latent variable may be interpreted as a continuous spectrum of injury risk or injury potential. The observed severity categories are formed by partitioning this latent continuum using a set of cut points, also referred to as thresholds. For a dependent variable with L ordered categories, the model estimates L −1 thresholds. In this study, where accident severity is classified into four levels, three thresholds are specified: the first threshold separates damage-only accidents from minor injuries, the second distinguishes minor injuries from serious injuries, and the third differentiates serious injuries from fatal outcomes.
The ordinal logistic regression model employed in this study is based on the proportional odds model (POM), which estimates the cumulative log-odds of an observation falling at or below a given severity category. The POM assumes a single set of regression coefficients that characterise the effects of the predictor variables on the cumulative odds across all severity thresholds. In practical terms, this framework allows for the assessment of how changes in the independent variables influence the likelihood of an accident resulting in higher severity outcomes relative to lower ones. A key feature of the POM is the assumption that the effects of the explanatory variables are constant across all thresholds of the ordinal outcome. This modelling approach enables the identification of factors that significantly increase or decrease the probability of more severe accident outcomes [21].
Consider Y as an ordinal outcome with J categories. Then, P (Y ≤ j) is the cumulative probability of Y less than or equal to a specific category j = 1, 2, 3, …, J – 1. It is important to note that P (Y ≤ J) = 1. The odds of being less than or equal to a particular category can be defined as in Eq. (3).
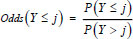 .....(3)
The cumulative log odds, which are also known as the cumulative logit, are determined by taking the logarithm of cumulative odds, as shown in Eq. (4).
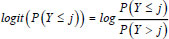 .....(4)
In the context of this study, let Y be the accident severity, and p1, p2, p3, and p4 be the proportions of accidents that led to damage only, minor injury, serious injury, and fatality, respectively. Thus, the cumulative logit derived from Eq. (4) is calculated as follows:
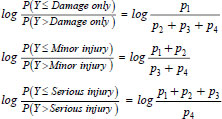
Principally, the cumulative logit quantifies how much more likely an outcome is to fall into category j or any category below it, compared to falling into any category above it.
The ordinal logistic regression model of n predictors is denoted in Eq. (5).
 .....(5)
Due to the parallel line assumption, the intercepts are different for each category, but the slopes are constant across categories, which simplifies the model to be in general form as in Eq. (6).
 .....(6)
By estimating the effect of each predictor on the odds of more severe accident outcomes, the model offers a detailed understanding of how individual factors contribute to injury severity. This facilitates the identification of key determinants that play a significant role in shaping accident severity.
4. RESULTS AND DISCUSSION
4.1. Data Description
This study established a baseline for analysis by first reviewing the historical accident data and frequency trends of the Shah Alam Expressway. The data served as the foundation for identifying safety patterns over the five-year study period. A total of 2,823 road accidents were recorded on the expressway between 2013 and 2017. Figure 1 illustrates the annual breakdown of these incidents. The highest frequency occurred in 2013, with 728 accidents reported. Meanwhile, 2014 and 2015 saw a significant decline, with approximately 30% lower than 2013; the figure rose again in 2016 and showed no substantial decrease in 2017.
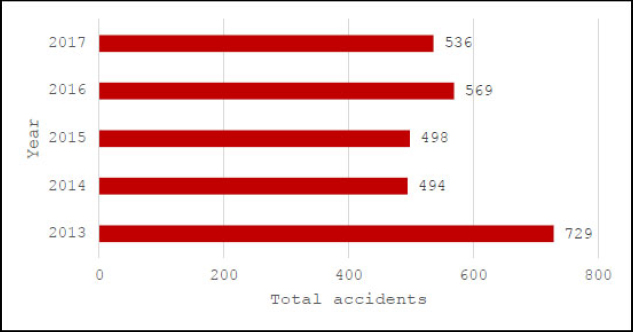
Total reported road accident cases for shah alam expressway (2013-2017).
Table 2 provides a breakdown of total road accidents categorized by route, recorded across east-bound, west-bound, and intersections. Between 2013 and 2017, the westbound route saw the highest frequency with 1382 accidents, followed by 1226 on the eastbound route, while intersections accounted for 215 reported accidents over the five years.
| Year | Route | Total | ||
|---|---|---|---|---|
| East Bound | West Bound | Intersection | ||
| 2013 | 330 | 330 | 68 | 728 |
| 2014 | 207 | 239 | 47 | 493 |
| 2015 | 203 | 244 | 49 | 496 |
| 2016 | 244 | 294 | 32 | 570 |
| 2017 | 242 | 275 | 19 | 536 |
| Total | 1226 | 1382 | 215 | 2823 |
Figure 2 illustrates the annual accident trends on the expressway, categorized by route. Both east-bound and west-bound incidents closely mirrored the total accident trend throughout the study period. In contrast, accidents at intersections followed a distinct pattern that deviated from the general expressway trends. While the eastbound and westbound routes exhibited nearly identical fluctuations, the data for intersections remained unique over the five years.
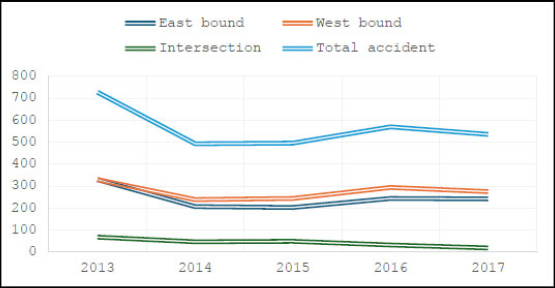
Road accident trend for shah alam expressway.
4.2. Data Segmentation
To ensure an in-depth understanding of high-risk locations, the study progressed to a systematic categorization of the recorded incidents. This phase involved partitioning the dataset into specific units to isolate localized safety concerns. The accident data were allocated to the appropriate segments and routes to facilitate a more structured analysis. This was achieved by assigning each accident record to specific columns corresponding to its pre-defined route and segment. Consequently, total accident counts were determined for each segment across the east-bound, west-bound, and intersections. A representative summary of these allocations is presented in Table 3.
| Segment | Location (KM) | 2013 | 2014 | 2015 | 2016 | 2017 | ||||||||||
|---|---|---|---|---|---|---|---|---|---|---|---|---|---|---|---|---|
| E | W | I | E | W | I | E | W | I | E | W | I | E | W | I | ||
| 1 | 18.0-18.4 | 2 | 1 | 0 | 0 | 0 | 1 | 0 | 1 | 0 | 0 | 0 | 0 | 1 | 1 | 0 |
| 2 | 18.5-18.9 | 4 | 2 | 3 | 0 | 1 | 0 | 1 | 2 | 3 | 2 | 2 | 2 | 4 | 0 | 1 |
| 3 | 19.0-19.4 | 1 | 3 | 0 | 1 | 3 | 0 | 1 | 1 | 0 | 1 | 0 | 0 | 2 | 2 | 0 |
|
|
|
|
|
|
|
|
|
|
|
|
|
|
|
|
|
| 69 | 52.0-52.4 | 0 | 1 | 6 | 0 | 0 | 11 | 0 | 0 | 10 | 0 | 1 | 2 | 0 | 1 | 0 |
| 70 | 52.5-52.9 | 0 | 0 | 0 | 0 | 0 | 0 | 0 | 0 | 0 | 0 | 0 | 0 | 0 | 0 | 0 |
Abbreviations: E: Eastbound, W: Westbound, I: Interchange
4.3. Accident Pattern Identification
In order to identify the accident pattern at east bound, west bound, and the intersection, a scatter plot was used as a statistical tool to represent the distribution. Prior to accident pattern identification, the outliers were determined using Eqs. (1 and 2). Table 4 shows the summary statistics used to find the upper and lower limits of the accident data.
| Route | Statistics | 2013 | 2014 | 2015 | 2016 | 2017 |
|---|---|---|---|---|---|---|
| East bound | Quartile 1 (Q1) | 2 | 1 | 1 | 1 | 1 |
| Quartile 3 (Q3) | 6 | 4.25 | 4 | 4 | 5 | |
| Interquartile range (IQR) | 4 | 3.25 | 3 | 3 | 4 | |
| Upper limit | 12 | 9.13 | 8.5 | 8.5 | 11 | |
| Lower limit | -4 | -3.88 | -3.5 | -3.5 | -5 | |
| West bound | Quartile 1 (Q1) | 2 | 1 | 1 | 2 | 2 |
| Quartile 3 (Q3) | 7 | 4 | 4.25 | 6 | 5 | |
| Interquartile range (IQR) | 5 | 3 | 3.25 | 4 | 3 | |
| Upper limit | 14.5 | 8.5 | 9.13 | 12 | 9.5 | |
| Lower limit | -5.5 | -3.5 | -3.88 | -4 | -2.5 | |
| Interchange | Quartile 1 (Q1) | 0 | 0 | 0 | 0 | 0 |
| Quartile 3 (Q3) | 3 | 4 | 3 | 3 | 1 | |
| Interquartile range (IQR) | 3 | 4 | 3 | 3 | 1 | |
| Upper limit | 7.5 | 10 | 7.5 | 7.5 | 2.5 | |
| Lower limit | -4.5 | -6 | -4.5 | -4.5 | -1.5 |
Based on Table 4, the upper control limits for each year are utilized to identify outliers within the scatter plots. Any data point exceeding the upper limit is classified as an outlier, signaling a clustering pattern caused by a high frequency of accidents at a specific location. Conversely, while the calculated lower limits in Table 4 are negative, a functional lower limit of zero is applied since accident data consist of non-negative counts. Consequently, this study focuses exclusively on the upper limit to detect the presence of outliers in the distribution.
Figure 3a–e presents the scatter plots depicting the frequency distribution patterns of accident data over five years along the eastbound route of the Shah Alam Expressway. Overall, the plots exhibited a consistent distribution pattern from 2013 to 2017. The outliers identified in these figures represent locations with exceptionally high accident frequencies, as determined by the upper limit values for the eastbound route in Table 4. The presence of these outliers indicates a distinct clustering pattern at specific geographic points along the Shah Alam Expressway.
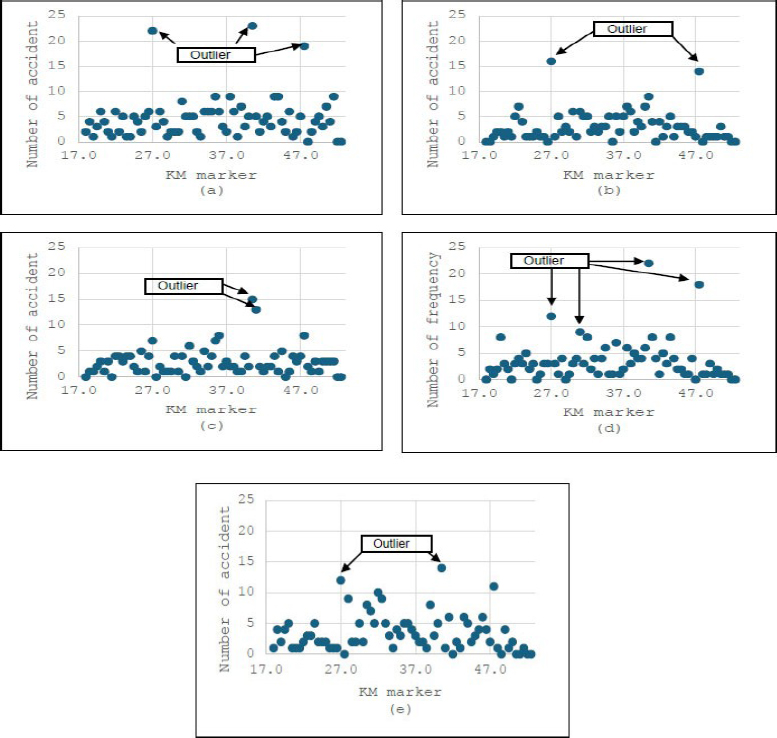
Mapping of the number of accidents at the kilometre marker of east bound for (a) 2013, (b) 2014, (c) 2015, (d) 2016, (e) 2017.
A similar frequency distribution analysis was conducted for the westbound route of the Shah Alam Expressway. Figure 4a–e presents the scatter plots that represent these accident patterns, identifying several outliers that indicate localized clustering. As with the eastbound data, these outliers were determined using the westbound upper limit values from Table 4, highlighting specific locations with disproportionately high accident rates.
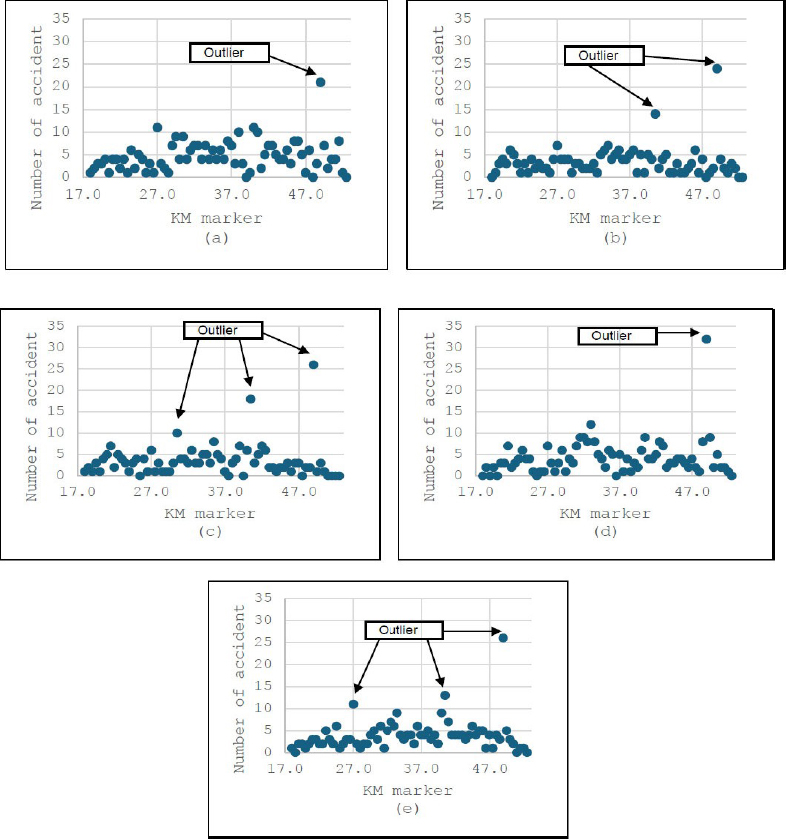
Mapping of the number of accidents at the kilometre marker of west bound for (a) 2013, (b) 2014, (c) 2015, (d) 2016, (e) 2017.
Figure 5a–e presents the scatter plots for road accidents specifically at intersections. A high density of data points was observed along the x-axis because the analysis isolated intersection data, effectively assigning a zero value to all other expressway locations. There are 15 intersections identified along the Shah Alam Expressway; accordingly, the summary statistics of Table 5 are calculated using data exclusively from these locations. The outliers identified in these figures signify localized clustering patterns at specific intersections for the corresponding years.
Mapping of the number of accidents at kilometre marker for intersections for (a) 2013, (b) 2014, (c) 2015, (d) 2016, (e) 2017.
Table 5 summarizes the locations with a high frequency of accidents along both the eastbound and westbound routes of the Shah Alam Expressway. Over the five-year study period, high accident occurrences were consistently recorded at nearly identical locations for both bounds. For the eastbound route, three specific segments, KM 27.0–27.4, KM 40.5–40.9, and KM 47.5–47.9, exhibited persistent high accident patterns from 2013 to 2017. Similarly, the westbound route had two primary high-accident segments at KM 40.5–40.9 and KM 49.0–49.5. Notably, these high-accident zones correspond to the toll plaza areas on both sides of the expressway.
| Year | East Bound | West Bound | ||||
|---|---|---|---|---|---|---|
| Number of outliers | Location (KM) | Total accident | Number of outliers | Location (KM) | Total accident | |
| 2013 | 3 | 27.0 – 27.4 40.5 – 40.9 47.5 – 47.9 |
22 23 19 |
1 | 49.0 – 49.4 | 21 |
| 2014 | 2 | 27.0 – 27.4 47.5 – 47.9 |
16 14 |
2 | 40.5 – 40.9 49.0 – 49.4 |
14 24 |
| 2015 | 2 | 40.5 – 40.9 41.0 – 41.4 |
15 13 |
3 | 40.5 – 40.9 30.5 – 30.9 49.0 – 49.4 |
18 10 26 |
| 2016 | 4 | 27.0 – 27.4 31.0 – 31.4 40.5 – 40.9 47.5 – 47.9 |
12 9 22 18 |
1 | 49.0 – 49.4 | 32 |
| 2017 | 2 | 27.0 – 27.4 40.5 – 40.9 |
12 14 |
3 | 27.0 – 27.4 40.5 – 40.9 49.0 – 49.4 |
11 13 26 |
Table 6 summarizes the high-accident locations for intersections along the Shah Alam Expressway. The data indicate that incidents at these intersections also followed a clustering pattern over the five years. Specifically, two locations, KM 38.5–38.9 and KM 52.0–52.5, consistently emerged as high accident locations. However, overall trends suggest that the frequency of accidents at these specific sites has declined gradually over the years.
| Year | Intersection | ||
|---|---|---|---|
| Number of Outliers | Location (KM) | Total Accident | |
| 2013 | 2 | 38.5 – 38.9 44.5 – 44.9 |
15 11 |
| 2014 | 1 | 52.0 – 52.5 | 11 |
| 2015 | 2 | 32.5 – 32.9 52.0 – 52.5 |
11 10 |
| 2016 | 0 | – | – |
| 2017 | 2 | 38.5 – 38.9 24.5 – 24.9 |
6 4 |
4.4. Accident Pattern Identification
Figure 6 shows that the majority of road accident cases on the Shah Alam Expressway resulted in no injury, accounting for 61.9% of the total, indicating that most accidents along this corridor were relatively minor in terms of physical harm. This is followed by light injuries, which comprised 28.9%, suggesting that nearly one-third of the reported incidents on the Shah Alam Expressway led to non-life-threatening injuries requiring minimal medical attention. In contrast, fatal accidents accounted for 5.7%, while severe injuries represented the smallest proportion at 3.5%. Although these categories occur less frequently, they reflect the most critical safety outcomes on the Shah Alam Expressway and highlight the potential severity of traffic incidents on this heavily used roadway. Overall, the distribution suggests that while most accidents do not result in serious injuries, a non-negligible share still leads to severe or fatal consequences, underscoring the need for continuous road safety and enforcement measures along the Shah Alam Expressway.
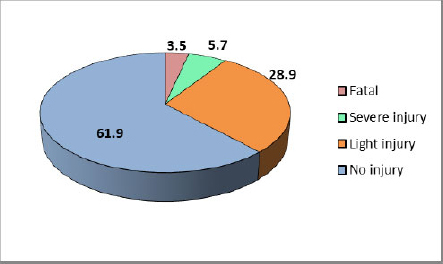
Percentage of severity levels.
Figure 7a and b depicts the heat maps that illustrate the spatial distribution and concentration of road accidents along the Shah Alam Expressway, differentiated by westbound and eastbound directions. In both maps, darker and more intense shading represents higher accident densities, indicating accident hotspots. For the westbound direction, accident concentrations were most prominent at KM49.2, KM40.5, KM38.7, and KM32.5. Among these, the clustering around KM40.5 and KM38.7 appeared particularly dense, suggesting recurring accident occurrences in these segments. These locations may correspond to complex traffic conditions such as interchanges, merging areas, or variations in road geometry that increase crash risk. In the eastbound direction, major accident hotspots were observed at KM40.5, KM47.5, and KM27.2. The intensity around KM40.5 was notable in both travel directions, indicating that this section is a bidirectional high-risk zone along the Shah Alam Expressway. The presence of direction-specific hotspots elsewhere implies that traffic flow characteristics, driver behaviour, or local infrastructure features differ between eastbound and westbound travel.
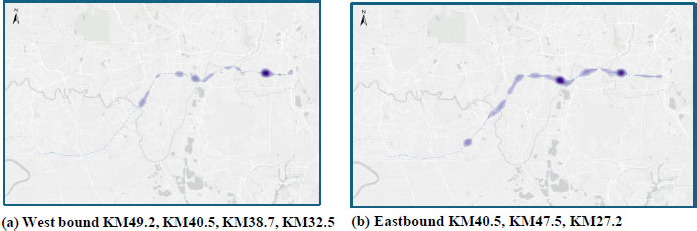
Heatmaps illustrating the spatial distribution and concentration of road accidents.
Overall, the heat maps revealed that accidents on the Shah Alam Expressway are not evenly distributed but are instead concentrated at specific kilometre markers. This spatial clustering highlights critical segments that warrant targeted safety interventions, such as enhanced enforcement, improved signage, geometric redesign, or localized traffic management measures. Identifying these hotspots provides valuable empirical support for prioritizing road safety improvements and resource allocation along the Shah Alam Expressway.
4.5. Global Moran’s I (Spatial Autocorrelation)
A statistical analysis using the Global Moran Index was conducted to examine the clustering pattern of road accidents along Malaysian inter-urban expressways using multiple bandwidth distances. The results indicated that accident occurrences exhibit different spatial patterns depending on the scale of analysis; thus, a sensitivity analysis was done to identify the optimal bandwidth that yields more accurate and reliable results.
Let n be the number of accident points and xi The accident value at the location i.
Moran’s I is calculated as in Eq. (7):
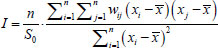 .....(7)
Where
wij = 1 if dij ≤ d (bandwidth),
wij = 0 otherwise,
S0 = Ʃi Ʃj wij .
and the Expected Value E[I] and Z-scores are calculated as follows Eq. (8):
 .....(8)
The results are interpreted based on the following rule:
zI > 0: clustered pattern; zI < 0: dispersed pattern and
| zI | > 1.96: statistically significant at α = 0.05
The results are summarized in Table 7. At a bandwidth of 250 m, the z-score was 3.025 (p = 0.002), indicating a statistically significant clustered pattern of accidents. Similarly, at a bandwidth of 500 m, the z-score increased slightly to 3.086 (p = 0.002), further confirming the presence of significant spatial clustering. These findings suggest that at smaller spatial scales, road accidents tend to concentrate in specific locations, which may correspond to hazardous road segments, interchanges, or areas with complex traffic conditions. In contrast, when the bandwidth was increased to 1000 m, the z-score decreased to 1.543 with a p-value of 0.123, indicating a random spatial pattern. This result implies that accident clustering becomes less pronounced at larger spatial scales, where localized high-risk areas are aggregated into broader regions.
| Bandwidth | West Bound | East Bound | ||||||
|---|---|---|---|---|---|---|---|---|
| Moran Index Value | z-score | p-value | Pattern | Moran Index Value | z-score | p-value | Pattern | |
| 250m | 0.021992 | 3.025090 | 0.002486 | Cluster | -0.002373 | -0.160160 | 0.872755 | Random |
| 500m | 0.015265 | 3.086267 | 0.002027 | Cluster | 0.006769 | 1.144021 | 0.252615 | Random |
| 1000m | 0.004875 | 1.542852 | 0.122867 | Random | 0.004661 | 1.197520 | 0.231104 | Random |
Overall, the findings highlight the scale-dependent nature of accident clustering on Malaysian inter-urban expressways. The presence of statistically significant clustering at shorter distances underscores the importance of conducting fine-scale spatial analyses to accurately identify accident-prone locations (black spots) and to design targeted highway safety interventions.
4.6. Ordinal Logistics Regression Model for Determinants of Road Accident Severity: A Case Study
The objective of this analysis was to identify the determinants of road accident severity using data from the Shah Alam Expressway from 2013 to 2017. By employing an ordinal regression framework, the complex interplay between environmental, temporal, and human factors was analysed. This section interprets the statistical findings, beginning with the model’s diagnostic integrity, such as model fitting, test of parallel lines, goodness of fit, and Pseudo R-square, before evaluating the specific impact of the predictors.
4.7. Model Fitting
The model fitting results in Table 8 indicate that the ordinal logistic regression models for all years (2013–2017) provided a significantly better fit to the data compared to the intercept-only models. For each year, the difference between the −2 Log Likelihood of the intercept-only model and the final model was statistically significant (p < 0.001). This suggests that the inclusion of the predictor variables (vehicle type, weather condition, causal factor, and time of occurrence) significantly improved the prediction of accident severity.
| Year | Model | -2 Log Likelihood | Chi-Square | df | Sig. |
|---|---|---|---|---|---|
| 2013 | Intercept only | 471.583 | - | - | - |
| Final | 182.264 | 289.319 | 8 | 0.000 | |
| 2014 | Intercept only | 357.866 | - | - | - |
| Final | 192.149 | 165.716 | 8 | 0.000 | |
| 2015 | Intercept only | 359.554 | - | - | - |
| Final | 177.205 | 182.349 | 8 | 0.000 | |
| 2016 | Intercept only | 412.788 | - | - | - |
| Final | 194.790 | 217.998 | 8 | 0.000 | |
| 2017 | Intercept only | 413.435 | - | - | - |
| Final | 216.574 | 196.861 | 8 | 0.000 |
The large chi-square values observed across all years (χ2 ranging from 165.716 to 289.319, df = 8) indicate that the set of independent variables contributed meaningfully in explaining the variations of accident severity levels (no injury, minor injury, serious injury, and fatal). Therefore, the fitted ordinal logistic regression models are appropriate for further interpretation.
4.8. Test of Parallel Lines
In this study, as shown in Table 9, the test was statistically significant (p < 0.05) for the majority of the study years (2013–2016), indicating that the proportional odds assumption is violated. This suggests that the relationship between the independent variables and the log odds of being in higher severity categories is not constant across all thresholds of the dependent variable. For the year 2017, the Test of Parallel Lines could not be fully evaluated due to estimation issues, which may be attributed to sparse data in some severity categories.
| Year | Model | -2 Log Likelihood | Chi-Square | df | Sig. |
|---|---|---|---|---|---|
| 2013 | Null hypothesis | 182.264 | - | - | - |
| General | 0 | 182.264 | 16 | 0.000 | |
| 2014 | Null hypothesis | 192.149 | - | - | - |
| General | 0 | 192.149 | 16 | 0.000 | |
| 2015 | Null hypothesis | 177.205 | - | - | - |
| General | 0 | 177.205 | 16 | 0.000 | |
| 2016 | Null hypothesis | 194.790 | - | - | - |
| General | 141.302 | 53.488 | 16 | 0.000 | |
| 2017 | Null hypothesis | 216.574 | - | - | - |
| General | 238.274 | n/a | 16 | n/a |
Despite this violation, it is crucial to note that ordinal logistic regression is often considered robust to moderate departures from the proportional odds assumption, particularly in large samples and exploratory or observational studies. As supported by methodological literature, violations of this assumption do not necessarily invalidate the overall conclusions of the research but may instead necessitate a more nuanced interpretation of individual coefficients [22]. Therefore, the models were retained for analysis, with results interpreted cautiously and emphasis placed on overall patterns rather than precise effect sizes.
4.9. Goodness of Fit
The goodness-of-fit statistics were done across 2013-2017. The Pearson chi-square tests were statistically significant (p < 0.001) for all years, suggesting a lack of perfect fit between the observed and expected frequencies. However, the Pearson statistic is known to be sensitive to large sample sizes and sparse cells. In contrast, the Deviance goodness-of-fit test showed a better fit for the 2013 model (p = 0.106), indicating no significant difference between the observed and model-predicted values. For the remaining years (2014–2017), the Deviance tests were statistically significant (p < 0.05), suggesting some degree of model misfit. Nonetheless, given the complexity of injury severity data and the presence of multiple categorical predictors, these results are not uncommon and do not necessarily undermine the overall usefulness of the models. The goodness-of-fit results suggest that while the models may not perfectly capture all variability in accident severity, they provide an acceptable approximation for identifying significant predictors and general trends.
4.10. Pseudo R-Square
The explanatory power of the models was assessed using three pseudo R-square measures: Cox and Snell, Nagelkerke, and McFadden, summarized in Table 10. Across all years, the Nagelkerke R-square values ranged from 0.332 to 0.401, indicating that approximately 33% to 40% of the variance in accident severity can be explained by the predictor variables included in the models.
| R-Square Measures | 2013 | 2014 | 2015 | 2016 | 2017 |
|---|---|---|---|---|---|
| Cox and Snell | 0.328 | 0.285 | 0.308 | 0.318 | 0.307 |
| Nagelkerke | 0.401 | 0..332 | 0.366 | 0.380 | 0.357 |
| McFadden | 0.234 | 0.171 | 0.201 | 0.211 | 0.186 |
The Cox and Snell values (0.285–0.328) and McFadden values (0.171–0.234) further supported a moderate model fit. These values are considered acceptable in behavioural and transport safety research, where injury severity is influenced by many unobserved and stochastic factors. Overall, the Pseudo R-square results suggest that the models have reasonable explanatory power.
4.11. Parameter Estimates
This section discusses the effects of vehicle type, weather condition, causal factor, and time of occurrence on accident severity for each study year (2013–2017) based on the ordinal logistic regression results. The interpretation is based on odds ratios (OR), where values greater than 1 indicate higher odds of more severe injury outcomes, and values less than 1 indicate lower odds, relative to the reference category. Table 11a to 11e present the results of parameter estimates for the ordinal logistic regression of the 2013-2017 road accident dataset.
| Variable | Estimate | SE | Wald | df | Sig | Lower | Upper | OR | Lower | Upper |
|---|---|---|---|---|---|---|---|---|---|---|
| Threshold | ||||||||||
| Severity type | ||||||||||
| No injury | 1.501 | 0.528 | 8.081 | 1 | 0.004 | 0.466 | 2.536 | 4.487 | 1.594 | 12.632 |
| Minor injury | 3.929 | 0.559 | 49.375 | 1 | 0.000 | 2.833 | 5.025 | 50.859 | 16.998 | 152.167 |
| Serious injury | 5.655 | 0.615 | 84.637 | 1 | 0.000 | 4.450 | 6.860 | 85.665 | 85.665 | 953.439 |
| Location | ||||||||||
| Vehicle type | ||||||||||
| Car | -0.068 | 0.305 | 0.050 | 1 | 0.823 | -0.665 | 0.529 | 0.934 | 0.514 | 1.698 |
| Motorcycle | 3.154 | 0.334 | 89.276 | 1 | 0.000 | 2.500 | 3.808 | 23.430 | 12.180 | 45.072 |
| Lorry 2-axle | 0.365 | 0.512 | 0.510 | 1 | 0.475 | -0.638 | 1.369 | 1.441 | 0.528 | 3.930 |
| Lorry 3-axle or more | -0.633 | 0.517 | 1.499 | 1 | 0.221 | -1.646 | 0.380 | 0.531 | 0.193 | 1.463 |
| Others | 0.000 | - | - | 0 | - | - | - | 1.000 | - | - |
| Weather | ||||||||||
| Good | -0.843 | 0.804 | 1.101 | 1 | 0.294 | -2.418 | 0.732 | 0.430 | 0.089 | 2.079 |
| Rain | 0.000 | - | - | 0 | - | - | - | 1.000 | - | - |
| Causal factor | ||||||||||
| Human | 0.818 | 0.839 | 0.951 | 1 | 0.329 | -0.826 | 2.462 | 2.266 | 0.438 | 11.723 |
| Vehicle | 0.247 | 1.014 | 0.059 | 1 | 0.807 | -1.740 | 2.234 | 1.280 | 0.176 | 9.336 |
| Environment | 0.000 | - | - | 0 | - | - | - | 1.000 | - | - |
| Time | ||||||||||
| Day | -0.056 | 0.192 | 0.085 | 1 | 0.771 | -0.432 | 0.320 | 0.946 | 0.649 | 1.377 |
| Night | 0.000 | - | - | 0 | - | - | - | 1.000 | - | - |
| Variable | Estimate | SE | Wald | df | Sig | Lower | Upper | OR | Lower | Upper |
|---|---|---|---|---|---|---|---|---|---|---|
| Threshold | ||||||||||
| Severity type | ||||||||||
| No injury | 0.270 | 1.009 | 0.072 | 1 | 0.789 | -1.708 | 2.249 | 1.310 | 0.181 | 9.477 |
| Minor injury | 2.353 | 1.018 | 5.340 | 1 | 0.021 | 0.357 | 4.348 | 10.514 | 1.429 | 77.334 |
| Serious injury | 3.644 | 1.038 | 12.338 | 1 | 0.000 | 1.611 | 5.678 | 38.255 | 5.007 | 292.295 |
| Location | ||||||||||
| Vehicle type | ||||||||||
| Car | 0.715 | 0.350 | 4.157 | 1 | 0.041 | 0.028 | 1.401 | 2.043 | 1.028 | 4.061 |
| Motorcycle | 1.107 | 0.537 | 4.242 | 1 | 0.039 | 0.054 | 2.160 | 3.025 | 1.055 | 8.673 |
| Lorry 2-axle | 0.931 | 0.453 | 4.237 | 1 | 0.040 | 0.045 | 1.818 | 2.538 | 1.046 | 6.162 |
| Lorry 3-axle or more | 3.179 | 0.383 | 68.900 | 1 | 0.000 | 2.428 | 3.929 | 24.011 | 11.336 | 50.858 |
| Others | 0.000 | - | - | 0 | - | - | - | 1.000 | - | - |
| Weather | ||||||||||
| Good | 1.475 | 0.864 | 2.918 | 1 | 0.088 | -0.217 | 3.167 | 4.371 | 0.805 | 23.746 |
| Rain | 0.000 | - | - | 0 | - | - | - | 1.000 | - | - |
| Causal factor | ||||||||||
| Human | -2.652 | 1.293 | 4.207 | 1 | 0.040 | -5.186 | -0.118 | 0.071 | 0.006 | 0.889 |
| Vehicle | -4.254 | 1.444 | 8.685 | 1 | 0.003 | -7.083 | -1.425 | 0.014 | 0.001 | 0.241 |
| Environment | 0.000 | - | - | 0 | - | - | - | 1.000 | - | - |
| Time | ||||||||||
| Day | -0.306 | 0.210 | 2.119 | 1 | 0.145 | -0.718 | 0.106 | 0.736 | 0.488 | 1.112 |
| Night | 0.000 | - | - | 0 | - | - | - | 1.000 | - | - |
| Variable | Estimate | SE | Wald | df | Sig | Lower | Upper | OR | Lower | Upper |
|---|---|---|---|---|---|---|---|---|---|---|
| Threshold | ||||||||||
| Severity type | ||||||||||
| No injury | 4.142 | 1.380 | 9.007 | 1 | 0.003 | 1.437 | 6.847 | 62.943 | 4.208 | 941.386 |
| Minor injury | 7.138 | 1.418 | 25.349 | 1 | 0.000 | 4.359 | 9.917 | 1259.275 | 78.215 | 20274.640 |
| Serious injury | 8.155 | 1.436 | 32.260 | 1 | 0.000 | 5.341 | 10.969 | 3479.225 | 208.643 | 58017.725 |
| Location | ||||||||||
| Vehicle type | ||||||||||
| Car | 0.548 | 0.349 | 2.471 | 1 | 0.116 | -0.135 | 1.231 | 1.730 | 0.874 | 3.424 |
| Motorcycle | 0.700 | 0.665 | 1.109 | 1 | 0.292 | -0.603 | 2.003 | 2.014 | 0.547 | 7.412 |
| Lorry 2-axle | 0.854 | 0.484 | 3.112 | 1 | 0.078 | -0.095 | 1.802 | 2.348 | 0.910 | 6.064 |
| Lorry 3-axle or more | 3.166 | 0.394 | 64.470 | 1 | 0.000 | 2.393 | 3.939 | 23.718 | 10.950 | 51.373 |
| Others | 0.000 | - | - | 0 | - | - | - | 1.000 | - | - |
| Weather | ||||||||||
| Good | 0.576 | 0.522 | 1.218 | 1 | 0.270 | -0.447 | 1.599 | 1.779 | 0.640 | 4.946 |
| Rain | 0.000 | - | - | 0 | - | - | - | 1.000 | - | - |
| Causal factor | ||||||||||
| Human | 2.205 | 1.238 | 3.171 | 1 | 0.075 | -0.222 | 4.632 | 9.070 | 0.801 | 102.736 |
| Vehicle | 0.515 | 1.367 | 0.142 | 1 | 0.706 | -2.163 | 3.194 | 1.674 | 0.115 | 24.392 |
| Environment | 0.000 | - | - | 0 | - | - | - | 1.000 | - | - |
| Time | ||||||||||
| Day | -0.051 | 0.215 | 0.057 | 1 | 0.811 | -0.473 | 0.371 | 0.950 | 0.623 | 1.449 |
| Night | 0.000 | - | - | 0 | - | - | - | 1.000 | - | - |
| Variable | Estimate | SE | Wald | df | Sig | Lower | Upper | OR | Lower | Upper |
|---|---|---|---|---|---|---|---|---|---|---|
| Threshold | ||||||||||
| Severity type | ||||||||||
| No injury | 3.198 | 1.621 | 3.891 | 1 | 0.049 | 0.021 | 6.376 | 24.494 | 1.021 | 587.720 |
| Minor injury | 5.697 | 1.642 | 12.036 | 1 | 0.001 | 2.478 | 8.915 | 297.951 | 11.923 | 7445.671 |
| Serious injury | 6.542 | 1.652 | 15.692 | 1 | 0.000 | 3.305 | 9.779 | 693.832 | 27.255 | 17662.791 |
| Location | ||||||||||
| Vehicle type | ||||||||||
| Car | 0.019 | 0.353 | 0.003 | 1 | 0.957 | -0.673 | 0.711 | 1.019 | 0.510 | 2.036 |
| Motorcycle | -0.139 | 0.719 | 0.037 | 1 | 0.846 | -1.549 | 1.270 | 0.870 | 0.213 | 3.561 |
| Lorry 2-axle | 1.356 | 0.446 | 9.249 | 1 | 0.002 | 0.482 | 2.230 | 3.881 | 1.620 | 9.301 |
| Lorry 3-axle or more | 2.852 | 0.388 | 53.987 | 1 | 0.000 | 2.091 | 3.612 | 17.315 | 8.092 | 37.050 |
| Others | 0.000 | - | - | 0 | - | - | - | 1.000 | - | - |
| Weather | ||||||||||
| Good | 0.791 | 0.549 | 2.075 | 1 | 0.150 | -0.285 | 1.867 | 2.205 | 0.752 | 6.467 |
| Rain | 0.000 | - | - | 0 | - | - | - | 1.000 | - | - |
| Causal factor | ||||||||||
| Human | 1.064 | 1.489 | 0.510 | 1 | 0.475 | -1.855 | 3.982 | 2.898 | 0.157 | 53.647 |
| Vehicle | -0.996 | 1.589 | 0.393 | 1 | 0.531 | -4.111 | 2.118 | 0.369 | 0.016 | 8.316 |
| Environment | 0.000 | - | - | 0 | - | - | - | 1.000 | - | - |
| Time | ||||||||||
| Day | 0.214 | 0.203 | 1.115 | 1 | 0.291 | -0.183 | 0.612 | 1.239 | 0.832 | 1.844 |
| Night | 0.000 | - | - | 0 | - | - | - | 1.000 | - | - |
| Variable | Estimate | SE | Wald | df | Sig | Lower | Upper | OR | Lower | Upper |
|---|---|---|---|---|---|---|---|---|---|---|
| Threshold | ||||||||||
| Severity type | ||||||||||
| No injury | 3.630 | 1.196 | 9.219 | 1 | 0.002 | 1.287 | 5.974 | 37.723 | 3.622 | 392.931 |
| Minor injury | 6.480 | 1.218 | 28.284 | 1 | 0.000 | 4.092 | 8.868 | 652.069 | 59.860 | 7103.137 |
| Serious injury | 7.102 | 1.226 | 33.562 | 1 | 0.000 | 4.700 | 9.505 | 1214.875 | 109.894 | 13430.406 |
| Location | ||||||||||
| Vehicle type | ||||||||||
| Car | 2.077 | 1.012 | 4.211 | 1 | 0.040 | 0.093 | 4.060 | 7.977 | 1.098 | 57.972 |
| Motorcycle | 4.749 | 1.025 | 21.476 | 1 | 0.000 | 2.740 | 6.757 | 115.415 | 15.491 | 859.913 |
| Lorry 2-axle | 2.564 | 1.132 | 5.133 | 1 | 0.023 | 0.346 | 4.783 | 12.994 | 1.413 | 119.451 |
| Lorry 3-axle or more | 2.428 | 1.037 | 5.486 | 1 | 0.019 | 0.396 | 4.460 | 11.340 | 1.486 | 86.518 |
| Others | 0.000 | - | - | 0 | - | - | - | 1.000 | - | - |
| Weather | ||||||||||
| Good | 0.334 | 0.336 | 0.991 | 1 | 0.320 | -0.324 | 0.992 | 1.397 | 0.723 | 2.697 |
| Rain | 0.000 | - | - | 0 | - | - | - | 1.000 | - | - |
| Causal factor | ||||||||||
| Human | 0.383 | 0.577 | 0.441 | 1 | 0.507 | -0.748 | 1.515 | 1.467 | 0.473 | 4.549 |
| Vehicle | -0.456 | 0.774 | 0.348 | 1 | 0.555 | -1.973 | 1.060 | 0.634 | 0.139 | 2.887 |
| Environment | 0.000 | - | - | 0 | - | - | - | 1.000 | - | - |
| Time | ||||||||||
| Day | -0.210 | 0.314 | 0.446 | 1 | 0.504 | -0.825 | 0.406 | 0.811 | 0.438 | 1.501 |
| Night | 0.000 | - | - | 0 | - | - | - | 1.000 | - | - |
In 2013, as shown in Table 11a, vehicle type is the dominant predictor of accident severity. Motorcycles were associated with a substantially higher likelihood of severe outcomes compared to the reference vehicle category. The odds of being involved in a higher severity accident for motorcycles were more than 20 times higher, highlighting the vulnerability of motorcyclists to serious and fatal injuries. In contrast, cars and lorries did not show statistically significant effects, suggesting that injury severity in 2013 was particularly concentrated among motorcycle crashes.
Weather conditions did not significantly influence accident severity. Although accidents occurring during good weather showed lower odds of severe injuries compared to rainy conditions, this relationship was not statistically significant, implying that weather alone does not meaningfully differentiate severity levels once a road accident occurs. For causal factors, neither human-related nor vehicle-related causes significantly affected injury severity compared to environmental factors. This suggests that in 2013, the severity of injuries was more strongly influenced by the type of vehicle involved than by the attributed cause of the accident. Similarly, time of occurrence (day versus night) was not a significant predictor, indicating that severity levels are comparable across different times of day.
The results for 2014, as presented in Table 11b, indicate a broader influence of predictors on accident severity. All categories of vehicle type (cars, motorcycles, and both light and heavy lorries) were significantly associated with increased injury severity. Notably, lorries with three axles or more exhibited particularly high odds of severe injuries, reflecting the greater impact forces involved in collisions with heavy vehicles.
Unlike 2013, causal factors in 2014 showed a significant relationship with severity. Road accidents attributed to human and vehicle-related causes were associated with significantly lower odds of severe injuries compared to environmental factors. This suggests that crashes caused by environmental conditions, such as road design or surface conditions at Shah Alam Expressway, tend to result in more serious outcomes during this year. Weather conditions showed a positive but non-significant association with severity, while time of occurrence again did not significantly affect injury outcomes.
The influence of vehicle type remained evident in 2015, particularly for heavy vehicles. Table 11c presents that lorries with three axles or more were strongly associated with higher accident severity, indicating a consistent risk posed by heavy vehicles across multiple years. However, motorcycles and cars did not show statistically significant effects for the year, suggesting some temporal variation in risk patterns.
The effects of weather conditions and time of occurrence remained non-significant, reinforcing the notion that these factors may contribute more to crash occurrence than to injury severity. For causal factors, human-related causes showed a positive but marginally non-significant association with accident severity. This indicates a possible trend toward higher severity in human-error-related accidents, although the evidence was not strong enough to draw firm conclusions.
The 2016 results, as presented in Table 11d, indicate a renewed importance of heavy vehicles in determining accident severity. Both two-axle lorries and lorries with three axles or more were significantly associated with higher injury severity. This finding suggests that collisions involving heavy vehicles consistently increase the likelihood of serious or fatal outcomes. In contrast, motorcycles and cars were not significant predictors in this year, indicating that the severity risk is more evenly distributed across vehicle types, except for heavy vehicles.
Weather conditions, causal factors, and time of occurrence did not significantly influence severity in 2016. This further supports the conclusion that structural and vehicle-related characteristics may play a more prominent role in determining injury outcomes than temporal or environmental conditions.
The results for 2017, as shown in Table 11e, indicate that vehicle type emerged as a strong determinant of accident severity. All vehicle categories (cars, motorcycles, and both types of lorries) were significantly associated with higher odds of severe injuries. Motorcycles, in particular, exhibited exceptionally high odds ratios, indicating a dramatically increased risk of serious and fatal injuries in 2017. Unlike previous years, the magnitude of vehicle-type effects in 2017 suggests a heightened vulnerability across all vehicle categories, potentially reflecting changes in traffic composition, speed, or exposure patterns.
As in earlier years, weather conditions, causal factors, and time of occurrence did not show statistically significant effects. This consistency suggests that while these variables are important for understanding crash causation, they may be less influential in differentiating injury severity levels once a road accident occurs [23, 24].
5. STUDY LIMITATION
This study features several limitations. First, reliance on official records may underreport minor accidents, while thedataset lacks key variables like driver behavior, weather, and real-time traffic volume. Second, the fixed 400-metersegmentation introduces boundary biases (MAUP); different segment sizes could alter identified hotspot locations. Third,the 2013–2017 dataset is historical and may not reflect recent infrastructure upgrades or current traffic patterns. Finally,because the research focuses solely on the highly urbanized Shah Alam Expressway, the findings may not generalize torural expressways or non-toll Malaysian roads with vastly different traffic and geometric characteristics.
CONCLUSION AND RECOMMENDATION
This study analysed 2,823 road accidents recorded between 2013 and 2017 on the Shah Alam Expressway to examine spatial–temporal patterns and determinants of accident severity. The results show that accident frequency peaked at 728 cases in 2013, declined by approximately 30% in 2014–2015, and increased again to 570–536 cases in 2016–2017, indicating temporal variability without sustained improvement. Spatial segmentation identified persistent high-risk locations, with recurring hotspots at KM40.5–40.9 in both directions; KM27.0–27.4 and KM47.5–47.9 (eastbound), and KM49.0–49.4 (westbound), where segment-level accident counts reached up to 32 cases annually.
Spatial autocorrelation analysis confirmed statistically significant clustering at smaller spatial scales (z = 3.086, p = 0.002 at 500 m), demonstrating that accidents are not randomly distributed but concentrated at specific segments. In terms of severity, 61.9% of accidents resulted in property damage only, while 28.9% involved minor injuries and 9.2% resulted in serious or fatal outcomes. The ordinal logistic regression model was statistically significant across all years (χ2 = 165.716–289.319, p < 0.001), with vehicle type identified as the most influential determinant of accident severity. These findings indicate that both spatial concentration and vehicle-related factors play a critical role in shaping accident risk and severity on inter-urban expressways.
Based on these findings, safety interventions should prioritise high-risk segments such as KM40.5–40.9 and toll/interchange areas through targeted engineering measures, including improved geometric design, signage, and traffic flow management. Given the strong influence of vehicle type on severity, vehicle-specific strategies-such as enhanced motorcycle lane design, stricter heavy vehicle regulation, and targeted enforcement-are recommended. Integrating location-based engineering improvements with vehicle-focused policies can provide a more effective and evidence-based approach to reducing both accident occurrence and severity on inter-urban expressways.
Given the expressway’s high volume of traffic and functional role as a major urban corridor, integrating these engineering measures with targeted enforcement and driver awareness campaigns would likely yield greater reductions in injury severity than infrastructure provision alone. Overall, the results suggest that while the existing road design of the Shah Alam Expressway provides a solid foundation for safety, further refinement and operational enhancements are necessary to effectively mitigate severe crash outcomes among vulnerable and high-impact vehicle groups Recent evidence from Malaysian expressways suggests that while road surface and maintenance significantly predict accident variance, they must be complemented by behavioral interventions to address the 'poor' safety perceptions held by high-impact vehicle operators, such as truck and bus drivers [25, 26].
Based on these findings, it is also evident that targeted and location-specific safety interventions are essential, particularly at segments with high accident frequencies and those involving fatal accidents. Special countermeasures such as improved road geometry, enhanced signage and markings, speed management strategies, and increased enforcement should be prioritised at identified high-risk locations [27]. By focusing resources on accident-prone segments and adopting a data-driven highway safety engineering approach, the potential exists to significantly reduce both the frequency and severity of road accidents along the Shah Alam Expressway.
For Malaysia, adopting a proactive and systematic approach to expressway safety can contribute significantly to national road safety targets. Collaboration between highway operators, enforcement agencies, and policymakers is essential to ensure that engineering measures are complemented by effective enforcement and public awareness initiatives [28]. Future research may extend this work by incorporating advanced analytical techniques such as spatial modelling, machine learning, or the integration of real-time traffic data, interpreting the level of accident severity in several more urban expressways. Such efforts can further strengthen the evidence base for relevant stakeholders in improving expressway safety and reducing the social and economic impacts of road accidents.
AUTHORS’ CONTRIBUTIONS
The authors confirm contribution to the paper as follows: S.Z.S.J, S.S.R.S, S.A.S, F.S.M.A.: Study conception and design; S.Z.S.J, S.S.R.S, S.A.S, F.O.: Data collection; S.Z.S.J., S.S.R.S, F.O.: Analysis and interpretation of results; S.Z.S.J., S.S.R.S., F.S.M.A.: Draft manuscript; S.Z.S.J, S.S.R.S, S.A.S, F.O.: Funding. All authors reviewed the results and approved the final version of the manuscript.
LIST OF ABBREVIATIONS
| NNH | = Neighborhood Hierarchical |
| STAC | = Clustering and Spatial Temporal Clustering |
| EFA | = Exploratory Factor Analysis |
| ML | = Machine Learning |
| OLR | = Ordinal Logistic Regression |
| POM | = Proportional Odds Model |
AVAILABILITY OF DATA AND MATERIALS
All the data and supporting information are provided within the article.
ACKNOWLEDGEMENTS
The authors would like to express their appreciation to the Faculty of Computer and Mathematical Sciences and Malaysia Institute Transport (MITRANS), Universiti Teknologi MARA Shah Alam, Malaysia for supporting this study and the experts from Shah Alam Expressway, Malaysia who helped and participated in the data collection process.